Monthly Archives: July 2011

Which colors should I pick?

Are you trying to come up with an effective color scheme for your website?

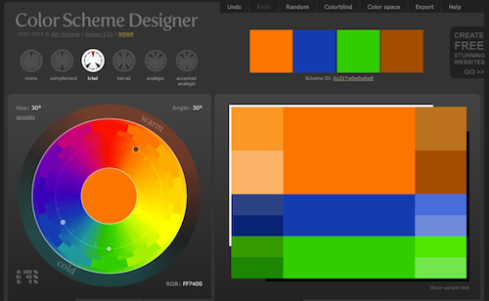
You can start from a web app helping you to match colors gracefully. The Color Scheme Designer, for instance.

color scheme

You can try infinite combinations of colors, take a look at the previews, consider color blindness and export your choices to CSS or Photoshop palettes.

Moreover, you can consider studying a little further on many articles like this or that.

Playing with colors is fun!

Analytics benchmarking

All the data collected from Nov 2010 to Feb 2011 by Google Analytics is now available through the anonymous data sharing tool.

Here we have some data aggregation by country The first number in each cell represents the metric for the date range Nov10 – Feb11. The parenthesized number is the Year over Year delta compared to a year ago. Broadly speaking, compared to a year ago, websites have seen reduced pages per visit, average time on site and bounce rate.

Moreover, here we have some data by traffic sources. The results about Adwords seem very good, compared to other sources.

Lastly, traffic sources below are identified by how the source and medium parameters are received by Analytics. I see the Other sources are far higher than the ones of the sites I manage.


QR codes? Like it!

Do you know QR codes? Pretty old stuff, uh?

A free service called Likify allows you to show your appreciation in the only way that counts: a thumbs-up on Facebook.

The service lets you generate a unique QR code, which can fit in posters, flyers, store fronts, advs, etc.

Each time someone scans the barcode, the number of Likes is tracked, supplying valuable statistics on where and when your items were liked.


Need a Screencast?

Screencast-o-matic is a web app allowing you to record a screencast with a couple of clicks.

You have several options to explore, or you can just click the red button and start recording! Easy and effective.


Twitter gets serious

Twitter released a Newsroom guide journalists in order to teach and explore everything you can do with it.

Here’s what they say about it:

We want to make our tools easier to use so you can focus on your job: finding sources, verifying facts, publishing stories, promoting your work and yourself—and doing all of it faster and faster all the time.

The guide is made of 4 parts:

REPORT: it’s about search, advanced and archive search, finding sources and mobile settings.

ENGAGE: here you can find some best practices about setting your account and creating effective content.

PUBLISH: everything on Twitter social plugins all over the web. Because you need it.

EXTRA: the place to go if you’re having some kind of trouble or you want to go deeper. Faqs, official blogs, data processing and data visualization.

There’s much more we can do with it. Let’s start!